Zoho Analytics App for the iPhone
The Zoho Analytics app for iPhone puts your business data in your pocket. It gives you secure, real-time access to the workspaces, reports, and dashboards that you create or that are shared with you in Zoho Analytics, so you can keep track of your key metrics wherever you are. The app is available for free on the App Store.
The app is built for business owners, managers, and analysts who need their numbers away from the desk. Explore and filter reports with touch gestures, ask Zia questions in plain language, and share, export, or comment on any view.
How Teams Use the App
Reviewing performance on the go: A sales manager opens the Sales dashboard on the way to a client meeting, filters it to the current quarter, and checks how the team is tracking against its target.
Getting quick answers from Zia: A store owner asks Zia, "What were the total sales by region last month?", and gets a chart in seconds, without having to search for the right report.
Collaborating with your team: A finance analyst notices a drop in revenue, adds a comment on the report, and @mentions the regional lead to look into it. The lead is notified on their phone and replies in the same thread.
Sharing insights with stakeholders: A marketing lead exports the campaign dashboard as a PDF and sends it to leadership through email, straight from the iOS share sheet.
What's New in Version 6.0.0
Version 6.0.0 is a native redesign of the app, built to be faster and easier to use. A new floating bar takes you to your favorites, workspaces, dashboards, and Ask Zia in a single tap, and dashboards now support tabs and filters.
Ask Zia now suggests prompts, remembers your recent conversations, explains changes in your data, and lets you add answers to a dashboard. Charts offer new options such as underlying data, insights, and data labels. Share, Export as PDF, and Comments sit in each view's More menu, and the app adds in-app notifications and Light and Dark themes.
Prerequisites
The Zoho Analytics app loads your reports and dashboards live from your Zoho Analytics account, so you need an active internet connection (cellular or Wi-Fi) to use it. You also need a Zoho Analytics account. If you don't have one yet, you can sign up for free directly from the app.
Supported iOS Versions
The Zoho Analytics app is supported on iPhones running iOS 17.6 and above. To check your iOS version, open your iPhone's Settings app and go to General > About.
Installing Zoho Analytics for iPhone
The Zoho Analytics app is free to download from the App Store. Once installed, it connects to your existing Zoho Analytics account, and all the workspaces you have access to on the web are available on your iPhone.
Follow the below steps to install the app:
- Open the App Store on your iPhone.
- Search for Zoho Analytics.
- Tap Zoho Analytics - Mobile BI App in the search results.
- Tap Get. The app will be downloaded and installed on your iPhone.
- Open the app and sign in with your Zoho account, or sign up for a new account.
Once you sign in, the app loads the workspaces you have access to, and you can start exploring your reports and dashboards right away.
Signing Up/In for Zoho Analytics
Signing Up for Zoho Analytics
If you are a new user, you can sign up for Zoho Analytics directly from the app.
Follow the steps below to sign up:
- Open the Zoho Analytics app and tap Sign Up.
- Enter the required details and tap SIGN UP FOR FREE.
Your Zoho Analytics account will be created, and the getting started screen will open.
Signing In to Zoho Analytics
If you already have a Zoho Analytics account, you can sign in with your existing credentials.
Follow the steps below to sign in:
- Open the Zoho Analytics app and tap Sign In.
- Enter the email address or mobile number of your Zoho account, and tap NEXT.
- Enter your password and tap SIGN IN.
You can also sign in using your Google, Microsoft, LinkedIn, Facebook, Twitter, Yahoo, Slack, or Apple account.
Note: If you are a member of more than one Zoho Analytics account, you can switch between them at any time from Settings > Switch account.
Working with the Zoho Analytics App
The Zoho Analytics app allows you to view, interact with, and collaborate on your reports and dashboards on the go. This section walks you through the home screen and explains how to find, organize, and manage the views you work with.
Note: You need an internet connection to open reports and dashboards. When you are offline, you can still browse the list of workspaces and views, but you cannot open them.
Understanding the Home Screen
The home screen is the starting point of the app. It lists your workspaces, dashboards, and reports as cards, and each card shows the item's name, its owner, and when it was last modified. This makes it easy to spot recently updated views at a glance.
The top bar gives you quick access to your account and to the content you need. It has the following options:
- Profile picture: Opens the Settings screen.
- Organization picker: If you belong to more than one organization, view items from all your organizations (All) or from a single one.
- Search: Finds a workspace, dashboard, or report by its name.
- Notifications (bell icon): Shows the recent activity in your account.
The floating bar at the bottom of the screen lets you switch between your lists:
- Favorites: Shows the items you have marked as favorites. Narrow the list down to Workspaces, Dashboards, or Reports.
- Workspaces: Lists all the workspaces you have access to. Choose Owned to see only the ones you created, or Shared to see the ones shared with you.
- Dashboards: Lists all the dashboards you have access to, with the same Owned and Shared options.
- Ask Zia: Opens the AI assistant.

Searching for Views
When you have many workspaces and views, searching is the fastest way to find what you need. Tap the Search icon in the top bar and type the name of the workspace, dashboard, or report you are looking for. Tap the item in the search results to open it.
To search only within a workspace, open the workspace and tap the Search icon at the top of the screen.
Sorting Views
You can sort any list alphabetically, or by when you last opened each item, so that the views you use most often stay at the top.
Follow the below steps to sort a list:
- Tap Sort by at the top of the list. Inside a workspace, tap the More icon and then tap Sort.
- Under by Name or by Recently accessed, tap Ascending or Descending.

Adding Views to Favorites
Favorites help you reach the workspaces, dashboards, and reports you use every day in a single tap. For example, if you check the Sales Summary dashboard every morning, mark it as a favorite, and it will always be available from the Favorites list.
To add an item to your favorites, tap the More icon on the item's card, or on the toolbar of an open view, and turn on the Favorites toggle. To remove it, turn off the toggle.
Note: Favorites are synced between the mobile app and the web version of Zoho Analytics, so a view you mark as a favorite on your iPhone also appears in your favorites on the web.
Managing Views
You can manage your dashboards and reports directly from the list, without opening them. Tap the More icon on a card to add the item to your favorites, view its details, move it to another folder, or delete it.

Tap Info to see the details of the item. The Info screen shows the item's title and description, the workspace and organization it belongs to, who created it and when, who last modified it and when, and its URL / Permalink. This is useful when you need to find out who owns a report, or when you want to check whether a dashboard is up to date.

Accessing a Workspace
A workspace in Zoho Analytics holds all the data, reports, and dashboards related to a specific business need, such as Sales Analysis or Help Desk Metrics. The Workspaces list on the app shows every workspace you own, along with the workspaces that have been shared with you.
Tap a workspace to open it. The views in the workspace are organized into the following tabs:
- Dashboards: Lists all the dashboards in the workspace.
- Reports: Lists all the charts, tables, pivot views, summary views, and other reports.
- Folders: Groups the views by the folders they are saved in, just as they are organized in the web version.
The icons at the top of the workspace help you find what you need faster:
- Favorites (heart icon): Shows only the views you have marked as favorites.
- Ask Zia: Lets you ask questions about the data in this workspace.
- Search: Finds a view in this workspace by its name.

Note: If a tab has no views, the app shows No items. Tap Refresh to reload the tab.
Workspace Options
Tap the More icon at the top right corner of the workspace to manage it. From this menu, you can sort the views in the workspace, add the workspace to your favorites, and see its details using Info. Turn on Default to make this the workspace that opens first when you start the app.
The menu also helps you keep your workspace organized. Use Create Folder to add a new folder, and View Trash to see the views that were deleted from the workspace. If you no longer need the workspace, tap Delete to remove it.

Organizing Views into Folders
Folders help you keep related reports and dashboards together. For example, you can create a Quarterly Reviews folder and move all the views you present each quarter into it.
Follow the below steps to create a folder:
- Open the workspace and tap the More icon.
- Tap Create Folder. The Create Folder screen opens.
- Enter the Folder Name and a Description (optional).
- Under Create Under, choose where to create the folder. By default, the folder is created at the top level of the workspace (/).
- To make this the default folder, turn on Make folder default.
- Tap the Save (check mark) icon.
To move a view into a folder, tap the More icon on the view's card, tap Move to Folder, and select the folder.
Setting a Default Workspace
If you spend most of your time in one workspace, set it as your default workspace. It will open as soon as you start the app.
You can set a default workspace in either of these ways:
- From the workspace: Open the workspace, tap the More icon, and turn on Default.
- From Settings: Go to Settings > Default workspace and choose the workspace.
Accessing Featured Samples
The sample gallery is a collection of ready-made workspaces built on data from popular business apps, such as Google Ads, Stripe, QuickBooks, and Zendesk. Each sample comes with dashboards that show how Zoho Analytics turns raw data into meaningful insights. Exploring the samples is a great way to get ideas for your own dashboards, or to try out the app before you add your own data.
You can open the sample gallery before you sign in, from the Sign Up/In screen, or at any time from the Settings screen.
From the Sign Up/In Screen
Tap the Explore sample gallery link on the Sign Up/In screen to browse the samples without signing in.
Note: When you open the gallery without signing in, you can only view the samples.
From the Settings Screen
Follow the below steps to open the sample gallery:
- Tap your profile picture at the top left corner of the home screen. The Settings screen opens.
- Tap Gallery. The samples are grouped by category, such as Marketing, Finance, and Help Desk.
- Scroll through the categories, or tap the Search icon to find a sample.
- Tap a sample workspace to see its dashboards.
- Tap a dashboard to open it.
Sample dashboards work just like your own. You can scroll through them, apply filters, and touch and hold the charts to see their values.
Accessing Dashboards
A dashboard brings several reports and KPI widgets together on a single page, giving you a complete picture of your business at a glance. Dashboards open in read-only mode, and you can use all the interactions that the reports in the dashboard support.
Understanding the Dashboard Layout
A dashboard on the app is made up of the following parts:
- Title: Shows the name of the current dashboard tab. Tap it to switch to another tab.
- Filter bar: Lists the dashboard's user filters, each with its current value. For example, Period set to Last 6 Months.
- KPI widgets: Highlight a key metric along with its trend and a comparison value, such as this month's revenue against last month's.
- Report cards: Show each report in the dashboard. Tap the Expand arrow at the top right corner of a card to open the report in full screen.
The toolbar at the top right corner of the dashboard has two icons:
- Comments: Opens the discussion on the dashboard.
- More: Lets you reload the dashboard using Refresh, add it to your favorites, Share it, Export as PDF, see its details using Info, or Delete it.

Switching Between Dashboard Tabs
Large dashboards are often split into tabs, so that each tab focuses on one part of the story. For example, a Deals dashboard might have a Trend Analysis tab and a Stage History tab. To switch tabs, tap the dashboard title at the top of the screen and select the tab you want to view.

Applying User Filters
User filters let you narrow down the data in a dashboard to exactly what you need, such as a specific time period, sales owner, or deal stage. When you change a filter, all the reports in the dashboard update to reflect the new value.
Follow the below steps to apply a user filter:
- Tap the filter in the filter bar, for example, Timeline Filter.
- Under SELECT A VALUE, tap the value you want, such as Last 3 Months or This Year. To use your own dates, turn on Custom Range and choose the start and end dates.
- Tap Apply.
The dashboard reloads with the filtered data, and the filter bar shows the new value.

Note: Reports that have user filters show the same filter bar, and you can apply the filters in the same way.
Accessing Reports
Reports in Zoho Analytics include charts, tables, query tables, pivot views, summary views, and tabular views. To open a report, tap it in the Reports tab of a workspace. Reports open in read-only mode, with interactions designed for touch.
The toolbar at the top of a report has two icons. Tap the Refresh icon to reload the report with the latest data. Tap the More icon to see all the actions you can perform on the report. From this menu, you can add the report to your favorites, open its Comments, Share it with others, Export as PDF, see its details using Info, or Delete it. Tap Tips for quick pointers on using reports on your iPhone.

Accessing Charts
Charts on the app are fully interactive. To see the exact values behind a chart, touch and hold anywhere on it. A tooltip appears, showing the value of each data series at that point. For example, in a chart that compares this year's revenue with last year's, the tooltip shows the revenue for both years in the selected month.
The legend below the chart title shows the color used for each data series, so you can tell the series apart. If the chart has user filters, use the filter bar at the top to narrow down its data. To learn how, refer to the Applying User Filters section.
Tap the Comments icon on the toolbar to discuss the chart with your team. The More menu of a chart gives you the following options:
- Underlying data: Shows the raw data behind the chart.
- Favorites: Adds the chart to your favorites.
- Share: Shares the chart with other users.
- Export as PDF: Exports the chart as a PDF file.
- Insights: Shows insights on the chart generated by Zia.
- Info: Shows the details of the chart.
- Delete: Deletes the chart.
- Tips: Shows tips on using charts on your iPhone.
- Change chart type: Shows the same data as a different type of chart.
- Data label: Shows or hides the values on the chart.

Accessing Tables, Query Tables, Pivots, Tabular and Summary Views
Tabular views show your data in rows and columns. Swipe up and down to scroll through the rows, and swipe left and right to see more columns. The icon in each column header shows the data type of the column, such as date or text, which helps you understand the data at a glance.
Tap the Refresh icon to load the latest data, and use the filter bar at the top to narrow down the data if the view has user filters.

Viewing Tables and Pivots as Web Views
By default, the app shows tables and pivot views in a layout designed for mobile screens. If you prefer to see them exactly as they appear in the web version of Zoho Analytics, you can switch them to web views.
Follow the below steps to show tables and pivots as web views:
- Tap your profile picture. The Settings screen opens.
- Tap Product settings.
- Turn on Pivot table as web view for pivot views, or Show table (Data), Query table, Summary & Tabular view as web view for tables and other tabular views.

Conversing with Ask Zia
Ask Zia is the AI assistant in Zoho Analytics. Zia understands questions in natural language, so instead of searching for the right report, you can simply type or say what you want to know, such as "Total sales by region". Zia analyzes your data and answers with reports, insights, and files. This is especially handy on your iPhone, when you need a quick answer and don't have time to browse through workspaces.
Accessing Zia
You can open Ask Zia from anywhere in the app. On the home screen, tap the Ask Zia button on the floating bar at the bottom of the screen. Inside a workspace, tap the Ask Zia icon at the top of the screen, and Zia will answer your questions using the data in that workspace.
Asking Zia a Question
Follow the below steps to ask Zia a question:
- Tap the input box, Ask and get analytical insights, and type your question. To ask by voice, tap the Mic icon and speak.
- Tap the Send icon.
Zia replies in the conversation, usually with a chart or a table that answers your question. If you want to know how Zia arrived at an answer, tap Agent thoughts to see the steps it followed. When Zia creates a file, such as a PDF export of a report, tap Open to view it.
Each answer comes with a thumbs-up and a thumbs-down icon. Rate the answers to let Zia know whether they were helpful, so it can keep improving.

Understanding Zia's Answers
When you ask Zia why a value changed, Zia explains the change and backs it up with data. For example, if you ask why sales dropped, Zia summarizes the drop, shows the values for both periods side by side, and lists the details under expandable sections:
- Top drivers impacting the value: The factors that contributed most to the change, such as the regions or product categories with the biggest drop.
- Missing Drivers With Possible Impact: The contributors that had no value in the later period, which may also explain the change.
- Explain the Model Used: How Zia calculated the explanation.
To keep an answer for later, tap Add To Dashboard below it. Zia also suggests Followups, which are related questions you can tap to explore the topic further.
Using Skills and Recents
If you are new to Zia or not sure what to ask, start with a suggested prompt. Tap the Skills icon at the top of the Zia screen to see two tabs:
- Skills: Offers suggested prompts grouped under Create Visualisation, such as "Total sales by customer name", and Help, such as "How to export multiple views?" Tap a prompt to ask it.
- Recents: Keeps a history of your earlier conversations. Tap a conversation to pick up where you left off.

Choosing a Conversation Mode
Zia can work in two modes. In Conversation Mode, Zia remembers the context of your earlier questions, so you can ask follow-up questions. For example, after asking for total sales by region, you can simply ask "Now show it by month". In Non-conversation Mode, Zia treats each question as a new request, which is useful when you want to ask unrelated questions one after another.
To change the mode, tap the Conversation icon at the top right corner of the Zia screen and select the mode you want. To start a fresh conversation at any time, tap the New conversation icon in the input box.

Note: Some actions, such as sharing a report through Zia, are not yet available on the mobile app. When you request such an action, Zia shows the message Unsupported feature. This feature isn't available on mobile devices yet. You can perform these actions from the app's menus or from the web version of Zoho Analytics.
Sharing Views
Zoho Analytics allows you to share your reports and dashboards with colleagues and clients, right from your iPhone. When you share a view, you decide exactly what each person can do with it. For example, you can let your sales team view a dashboard and comment on it, while allowing only managers to export its data.
Sharing a View with Users or Groups
Follow the below steps to share a view:
- Open the report or dashboard you want to share.
- Tap the More icon and tap Share. The Share screen opens.
- In the Email id or group name field, enter the email addresses or group names of the people you want to share the view with.
- Tap Access Level and turn on the permissions you want to give. The permissions are explained in the next section.
- Navigate back to the Share screen.
- Keep the Notify toggle on to send the users an email invitation. You can edit the SUBJECT and MESSAGE of the email to add your own context.
- Turn on Send a copy to me if you want to receive a copy of the invitation.
- Tap Share.
The view is now shared, and the users can open it from the web or from their own mobile app.

Note: Workspace admins can already access all the views in the workspace. If you add an admin's email address, the app shows the message The view cannot be shared to Admin itself. Please remove the Admin email id. Remove the admin's email address to continue sharing.
Access Level Permissions
The Access Level screen controls what the users can do with the shared view. Read Access is always included, and you can add more permissions as needed.
Under READ OPTIONS, Read Access allows the user to view the report or dashboard, and is the default permission. Export Data allows the user to export the view. View Underlying Data allows the user to see the raw data behind the report, and Zia Insights allows the user to get AI-generated insights on the view from Zia.
Under SHARING AND COLLABORATION OPTIONS, Share Views/Child Reports allows the user to share the view, and the reports in it, with other users. Allow Commenting allows the user to take part in discussions on the view.

Viewing Who Can Access a View
Before you share a view, you may want to check who already has access to it. On the Share screen, tap Who can access to see the list of users. The number next to it shows how many users currently have access.
Sharing a View with a Permalink
A permalink is a direct link to a view that you can send through email, chat, or any other app. The URL / PERMALINK section of the Share screen offers three options, depending on who should open the link.
Choose Access With Login when the link is meant for users who have a Zoho Analytics account. They are asked to sign in when they open the link, so make sure the view is shared with them first. Choose Access Without Login when you want anyone with the link to open the view without signing in, even though the view is private. Use Access within Organization / External Users to decide whether the link can be opened only by users in your organization or by external users as well.

Exporting Views
Zoho Analytics allows you to export your reports and dashboards as PDF files. Exporting is useful when you want to keep a copy of a view for offline reference, attach it to an email, or share it with people who do not use Zoho Analytics. For example, you can export your monthly sales dashboard and send it to your leadership team before a review meeting.
Follow the below steps to export a view:
- Open the report or dashboard you want to export.
- Tap the More icon and tap Export as PDF. A preview of the PDF file opens.
- Tap the Share icon in the preview.
- In the iOS share sheet, choose what to do with the file. Tap Save to Files to save it on your iPhone, Print to print it, or Markup to add notes and highlights. You can also send the file through any app installed on your iPhone, such as Mail or Messages.

Adding Comments
Comments let you discuss a report or dashboard with your colleagues and clients, right where the data is. Instead of taking a screenshot and sending it over chat, you can ask a question on the view itself, @mention the people who need to respond, and attach related reports or files. Everyone in the conversation sees the same data, which keeps the discussion focused and easy to follow.
Opening Comments
How you open comments depends on the type of view. In a report, tap the More icon and then tap Comments. In a dashboard, tap the Comments icon on the toolbar.
Adding a Comment
Follow the below steps to add a comment:
- Tap Type your comment and type your comment.
- To format your comment, use the Bold, Italic, Underline, and Strikethrough options that appear above the keyboard.
- To bring a colleague into the conversation, type @ and select the person from the list. They are notified about your comment.
- Tap the Send icon.
Your comment appears in the conversation, grouped under the day it was posted.

Note: The people in the conversation need read permission on the view to open it.
Adding Reports and Files
You can give your comment more context by attaching a related report or a file. To attach a report from the same workspace, tap the Report icon on the left of the input box and select the report. To attach an image or a document, tap the + icon and tap Gallery or Document.

Replying to and Managing Comments
Touch and hold a comment to see the actions you can perform on it. Tap Like to acknowledge the comment, or Reply to respond to it in the same conversation. Tap Copy to copy the text of the comment, or Delete to remove it.

Adding Participants
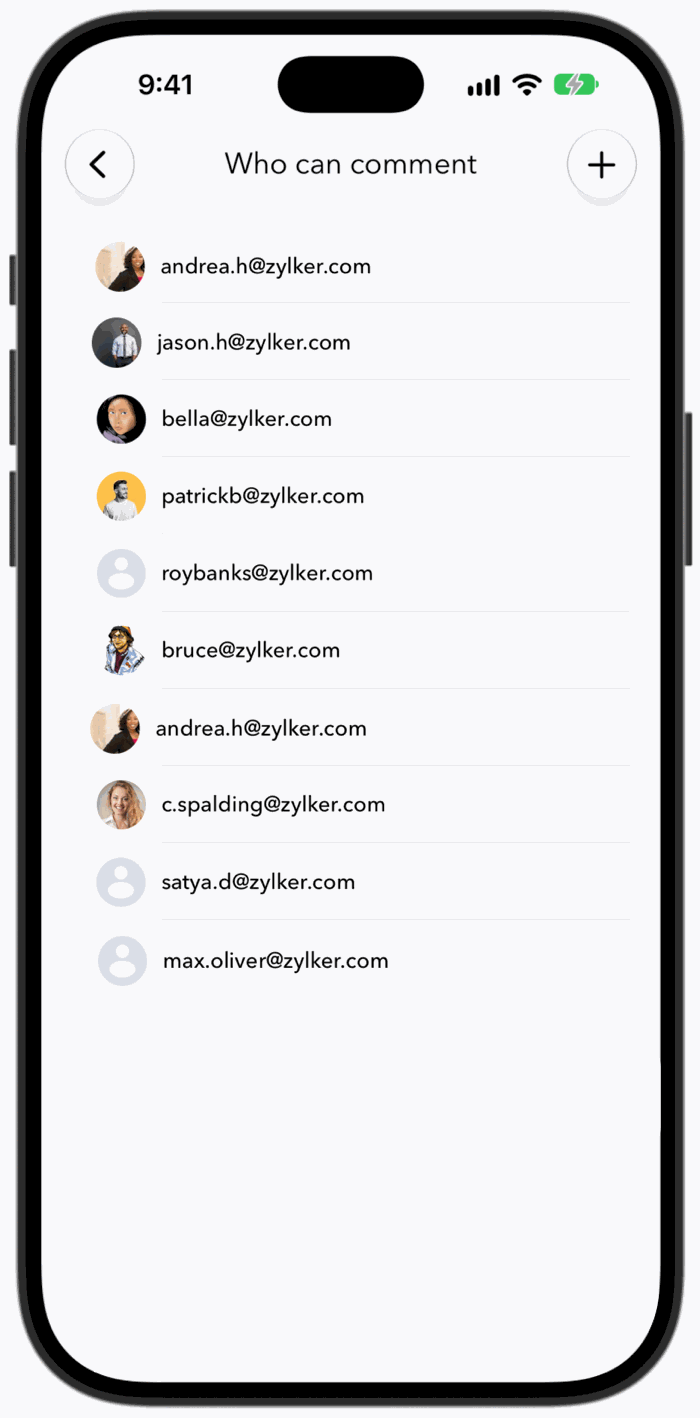
The Who can comment screen lists everyone who can take part in the conversation on a view. You can invite more people from this screen at any time.
Follow the below steps to add a participant:
- On the Comments screen, tap the Participants icon at the top right corner. The Who can comment screen opens.
- Tap the + icon.
- Enter the email address of the user and set the Access Level, just as you would when sharing a view. Make sure Allow Commenting is turned on.
- Tap Share.
Notifications
Notifications keep you informed about what is happening in your Zoho Analytics account, even when you are away from your desk. The app notifies you when a view or dashboard is shared with you, when someone comments, replies, or likes a post on a view shared with you, and when someone requests access to one of your views.
You are also notified about changes to your account and data. This includes being added to or removed from a group, being added or removed as a workspace admin, a scheduled import failing, a change in the status of a data integration, and a data alert being triggered.
Viewing Notifications
Tap the Notifications (bell) icon at the top right corner of the home screen to see all your notifications, with the latest one on top. Names highlighted in a notification, such as a workspace name, are links. Tap them to open the item directly.
When you have many notifications, you can view one type at a time. Tap the Filter icon and select Share, Alerts, Comments, Warnings, Accounts, or Data Sync. Select All to see all your notifications again.
Choosing Your Notifications
You can choose which types of activity you want to be notified about, so that you only receive the notifications that matter to you.
Follow the below steps to set your notification preferences:
- Tap your profile picture. The Settings screen opens.
- Tap Notification Preference. You can also open this screen from the Settings icon on the notifications screen.
- Turn on or off the toggle for each notification type.
The Share toggle covers reports, dashboards, and tables shared with you, and Group covers your account being added to a group. Commenting covers comments, replies, mentions, and likes, and Schedule covers scheduled actions that fail. Account actions notifies you when a user is added or removed, or when a user's role is changed, and Data sync notifies you when a data sync completes, fails, or is disabled.
Note: The Share, Group, Commenting, and Schedule preferences are synced between the mobile app and the web version of Zoho Analytics.
Turning Push Notifications On or Off
Push notifications appear on your iPhone's lock screen and notification center, even when the app is closed. To turn them on or off, go to Settings > Privacy & security and use the Push notifications toggle.
Settings
The Settings screen lets you personalize the app and manage your account. To open it, tap your profile picture at the top left corner of the home screen. The top of the screen shows your name and email address, along with the app version, your device, and its iOS version. These details are useful when you contact Zoho support.

Customizing Themes
You can choose how the Zoho Analytics app looks. On the Settings screen, tap Light for a light background, or Dark for a dark background that is easier on the eyes in low light. If you prefer the app to match the rest of your iPhone, tap Device. The app then switches between light and dark automatically, based on your iPhone's appearance setting.
Privacy and Security Settings
The Privacy & security screen controls what the app shares with Zoho and protects the data shown in the app. To open it, tap Privacy & security on the Settings screen. It has the following options:
- Push notifications: Turns notifications on or off. They are delivered through the Apple Push Notification service (APNs).
- Send crash report: Sends a report to Zoho when the app crashes.
- Send statistical data: Shares usage statistics to help improve the app.
- Share to feedback: Includes this information when you send feedback.
- Send anonymously: Shares the data without identifying you.
- Allow screenshot & screen recording: Turn it off to block screen capture in the app.
To read the terms, tap Terms of service or Privacy policy at the bottom of the screen.
Other Settings
The Settings screen also has the following options:
- Switch account: Moves between your Zoho Analytics accounts.
- Default workspace: Sets the workspace that opens when you start the app.
- Product settings: Shows tables and pivot views as web views.
- Notification Preference: Chooses the notifications you receive.
- Feedback: Sends your suggestions to the Zoho Analytics team.
- Gallery: Opens the sample workspaces.
- Tips and What's new: Show helpful pointers and the latest updates.
- About: Shows information about the app.
- Close account: Closes your Zoho account.
- Sign out: Signs you out of the app.
Frequently Asked Questions
Can I edit reports and dashboards on the app?
No. Reports and dashboards open in read-only mode on the app, so you can view, filter, share, export, and comment on them. To create or edit reports and dashboards, use the web version of Zoho Analytics.
Can I open my reports when I am offline?
No. The app loads your reports and dashboards live from your Zoho Analytics account, so you need an internet connection to open them. When you are offline, you can only browse the list of workspaces and views.
In which format can I export views?
You can export reports and dashboards as PDF files. After you export a view, use the iOS share sheet to save the file to your iPhone, print it, or send it through another app.
Why can't I share a view with a workspace admin?
Workspace admins already have access to all the views in the workspace, so there is no need to share views with them. Remove the admin's email address from the Email id or group name field and share the view with the other users.
Why does Zia show the message "Unsupported feature"?
Some actions, such as sharing a report through Zia, are not yet available on the mobile app. You can perform these actions from the app's menus, for example, by tapping More > Share on the view, or from the web version of Zoho Analytics.
Do my favorites appear on the web version as well?
Yes. Favorites are synced between the mobile app and the web version of Zoho Analytics, so you see the same favorites wherever you sign in.
How do I switch to the dark theme?
Open the Settings screen and tap Dark. If you want the app to follow your iPhone's appearance setting instead, tap Device.